Johns Hopkins HealthCare (JHHC), the managed care division of Johns Hopkins, has been a long-time user and test site for the Johns Hopkins ACG System. In 2019, the JHHC clinical analytics team wanted to take their population monitoring a step further. They could already accurately identify patients at high risk of cost, admissions or readmissions using the ACG System, but found that generalized prediction groups weren’t always resonating with case managers or clinical leadership. So JHHC analysts decided to test the ACG System’s Patient Need Groups (PNG) approach, to help clinicians understand population needs through a segmentation lens – including why a patient was identified as high risk – and to focus efforts on more actionable patient groups.
As we recently announced, we’re launching a brand-new segmentation module, called Patient Need Groups (PNGs). At its core, the PNG Module has three components:
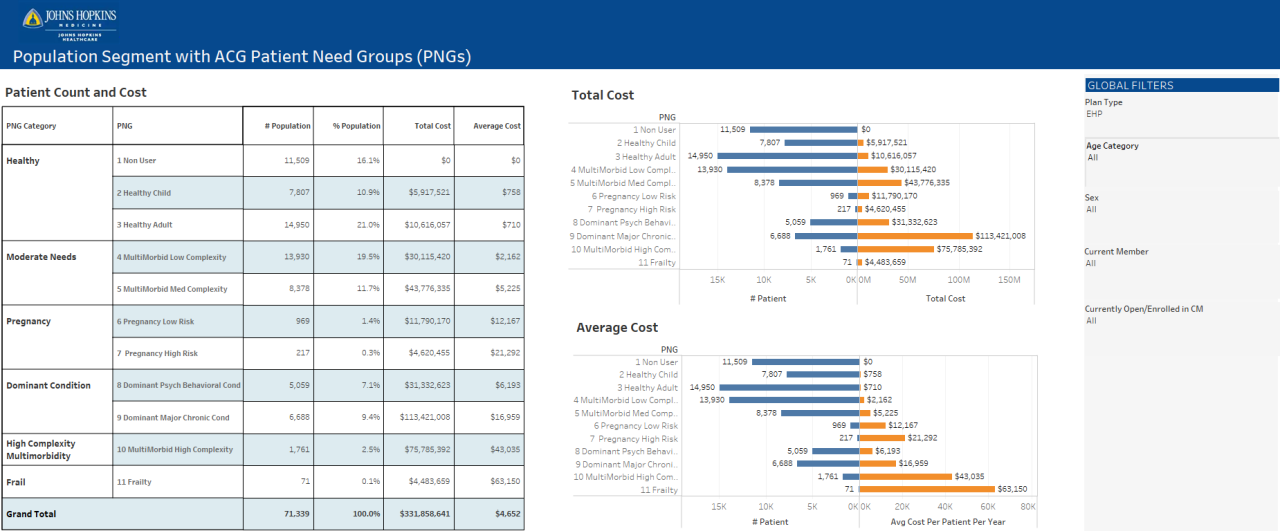
Once testing was complete, JHHC’s analytics team used the new PNGs and Care Modifiers to create a production dashboard that can inform population monitoring and strategic planning. The segment-level view describes prevalence, utilization and key cost metrics, providing clinical leadership with at-a-glance understanding of population dynamics and opportunities.

This new approach allowed clinical leadership to understand population distribution across health need groups and easily identify the volume of patients in high-needs segments who were driving the plan’s cost and utilization.
To meet the leadership’s focus on actionable opportunities to improve health and reduce cost, the analytics team leveraged the ACG System’s PNG Care Modifiers component to visualize the frequency of these impactable factors within population segments. The Care Modifiers easily quantify distinct opportunities to improve care, and showcase the outcome differences between various subsets.
For example, application of the mental health care modifier highlighted vast differences in cost and utilization among commercial population patients with a mental health condition. Understanding the magnitude of mental health conditions’ impact on overall health outcomes led the plan to offer the Johns Hopkins BalanceTM mental health program to its own employees.
For Johns Hopkins HealthCare, a dashboard built upon the ACG System’s PNG segmentation model provided key insights into the overall population’s varying hierarchy of clinical need and allowed for rapid drill-down into a sub-population’s specific risk factors. Having this information at decision makers’ fingertips allows for rapid identification of how to meet the population’s need.
Ultimately, the Patient Need Groups segmentation model-derived dashboards provide critical, quick-look analytics to health care organizations that support clinical management development. By combining Patient Need Groups population segments and Care Modifiers with other outputs from the ACG System, you can isolate populations and derive clinically meaningful and actionable insights within a few clicks, driving your clinical management strategy towards precise goals that are reflective of your unique population.
To read more about how Johns Hopkins HealthCare used PNGs to isolate populations and derive clinically meaningful and actionable insights, click here.
Follow Us