Population Health Analytics
The Benefits of Using Primary Care Data in Population Health Management Analyses – Part I
|
Population Health Management & Improvement |
Risk Stratification & Population Segmentation


We talk to our Dr James Barrett, Senior Technical Consultant at Johns Hopkins HealthCare Solutions, about the importance of using a combination of primary care and secondary care data in Population Health Management and the added value this brings. James presented this work at the PCSI conference in Slovenia in May 2024. This is part 1 of a 2-part series.
Hi James, can you just set the scene by telling us about population health management and what you are doing at Johns Hopkins HealthCare Solutions in the UK?
Yes of course. Population Health Management (PHM) is a data-driven methodology which aims to improve the health of the whole population. PHM techniques include population profiling to understand health needs, which are then followed by targeted interventions to improve the physical and mental health of specific segments of the population. This means that scarce resources can be allocated based on measured need. We work with NHS clients and others to provide the Johns Hopkins Adjusted Clinical Groups (ACG®) System to enable people to risk stratify and carry out population profiling to target the right people with the right care.
That sounds excellent! Can you tell us a bit about the type of datasets that are available in the UK that can be used by the ACG system?
In the UK, in common with many other countries worldwide, national datasets from secondary care (hospitals) are readily available. However, there are limitations with the coverage and completeness of secondary care datasets which may impact their suitability for use in PHM.
We can use both primary care (1o care) datasets and secondary care (2o care) datasets within the Johns Hopkins ACG system. We felt there was genuine value in adding a primary care dataset to PHM, so we carried out a study of the differences in disease prevalence for the same UK population using primary care data only; compared with secondary care data only and then with the two combined. From this study we were able to establish the extent of morbidity information that is present in one data set and not in the other. The impact of these differences on typical PHM analyses was also assessed.
What did you find out?
We found that there were real differences in the comprehensiveness, completeness and richness of datasets that do and do not include full primary care data. Significant conditions such as angina, eczema and depression are often not present in the secondary care record, as these conditions can be managed in primary care. We also observed that only a small proportion of the total population will be treated in a hospital setting in any given year meaning that there were no records for up to 80% of the population in the secondary care dataset.
Before we look at the results, can you tell us a little bit more about segmentation?
Of course – segmentation is one of the key population health analytic techniques. There are many different segmentation methodologies but we’re going to look at Patient Need Groups or PNGs, which are a component of the ACG System software.
There are 11 mutually exclusive PNGs within the ACG System and each patient in the population is assigned to one group only. The PNG segments are listed in the two illustrations in the results section below.
Each segment contains patients with similar clinical needs which helps align groups of patients to an appropriate care management intervention – for example remote monitoring. Patients within a segment can also be filtered to fine tune a group of patients for a particular intervention.
Tell us more about the results.
We used hospital inpatient or secondary care data and primary care data for a small population of about 30,000 patients. Three sets of data were processed by the ACG system:
- Secondary care data only
- Primary care data only
- Secondary care data and primary care data combined
The main outputs from the ACG System that we looked at were the PNG segment that a person was assigned to and the prevalence figures for a range of common diseases.
Let’s look at a comparison of the PNG distribution using just secondary care data with that using the combined dataset:
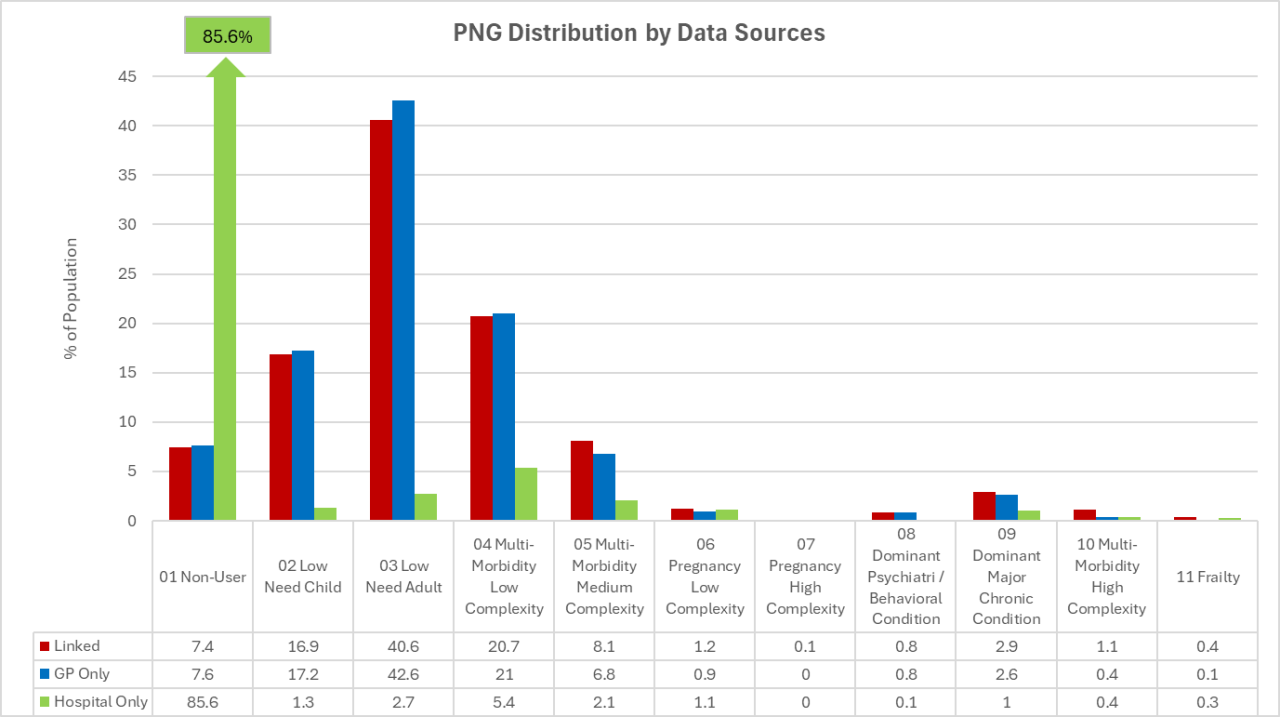
The 2o care only distribution is shown in green and you can see that most patients have no information at all and are in PNG 01 “Non-user”. The distribution for the combined data is shown in red; you can see that now we have information on over 90% of the population, and that the lower PNGs are well populated. There is a significant increase in the number of patients in the higher PNGs as well.
That’s really interesting! Can you tell us a bit more about how patients move up the PNG hierarchy with the addition of primary care data?
Yes of course. Let’s take a look at this matrix, which shows how patients change PNG when you add in primary care data:
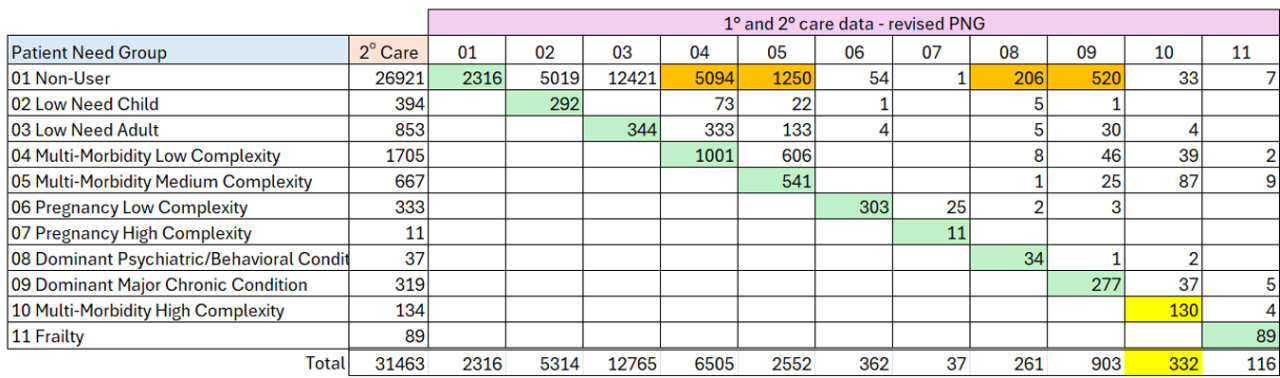
On the diagonal (cells shaded green) you can see the number of patients who do not change their PNG segment. In the higher PNGs it looks as though most patients are in the right segment (but see below).
We can now see where the PNG 01 Non-users move to when you add in primary care data (cells shaded orange). Many non-users are now identified as having some multi-morbidity. But note how many patients with a dominant condition (PNGs 08 and 09) are classified as non-users with no primary care data.
If we focus on the totals row, we can see that significant numbers of patients in the higher PNGs are actually not identified by the hospital data. Only 30% of the patients in PNG 10 are identified in the hospital data alone (cells shaded yellow).
So, what did you conclude?
In general, secondary care data is more available than primary care data and many PHM projects are based on secondary care data alone. However, what we have discovered is that a significant amount of morbidity is only seen in primary care data. We believe that analysts and clinicians need to be aware of the limitations of using only a secondary care data set to draw conclusions about the prevalence and distribution of need and morbidity burden within a population. Specifically, they should be aware that:
- Using secondary care data only will miss the needs of a large proportion of the population who have no interaction with secondary care.
- Many diseases (including many chronic or long-term conditions such as depression, eczema, arthritis or endometriosis) will only be recorded in the primary care data set.
- These other conditions (most of which do not form part of the Quality and Outcomes Framework (QOF) disease registers) contribute significantly to the morbidity burden within a population and should be considered when measuring and comparing need.
Our recommendation, as a result of this work, is that wherever possible, a data set that includes both primary and secondary care data should be used when trying to understand the needs of a population.
Thanks so much James, really interesting! What can we look forward to in part two of this blog?
In the second part of this blog we will share some interesting and insightful PHM-based analyses that simply would not be possible with just secondary care data alone.
Watch for part 2 of this series coming in October.
Sign up for blog alerts and other insights from the ACG System team
Follow Us