In recent blog posts focused on health disparities, we’ve discussed the importance of EHR records capturing as much relevant patient data as possible. Today, we will further examine the emerging data that ACG System users can collect in order to fully understand patient demographics and geography in their population. These measures of health equity and utilization by race and ethnicity can help users understand how their local population uses the health care services available to them.
There is inherent risk involved when a health care entity contractually agrees to pay for the total cost of health care for a defined population. Prior to the agreement, the entity must determine how many resources are available to ensure high-quality, low-cost care.
ACG System users have access to advanced datasets and insights that allow them to estimate the expected need for health care services. Using the ACG System, health systems and providers are able to identify a majority of the risks that affect the overall health of their population, including equitable distribution of health care services.
Evidence shows that in order to equitably distribute health care resources, race and ethnicity need to be analyzed. To illustrate, we used a sample of data from an adult Medicaid population. We first input race and ethnicity data and analyzed these indicators on an individual-person basis. Next, we turned to the Resource Utilization Band (RUB) for further understanding. (The RUB is a person-level indicator of the expected need for health care services.)
Finally, we asked two questions to better understand whether health care resources are equitably distributed among our sample:
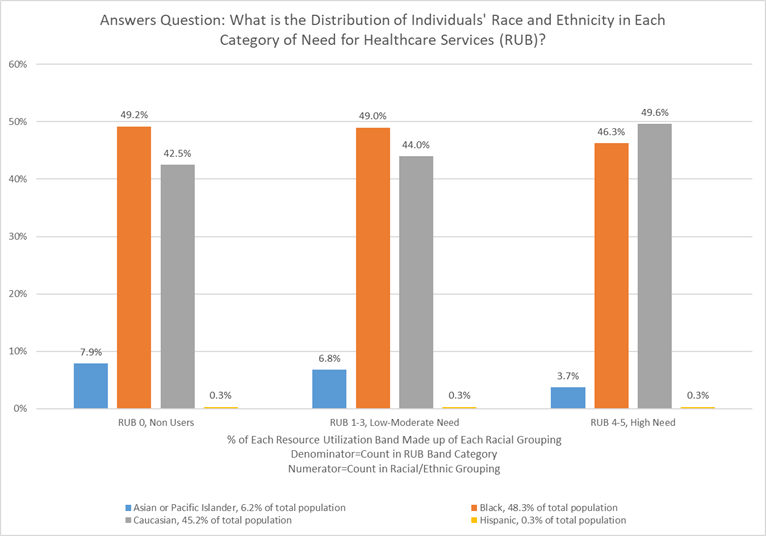
Question #1: What is the distribution of individuals’ race and ethnicity in each category for the anticipated use of health care resources (RUB)? (i.e., What portion of each RUB does each race/ethnic group represent?)

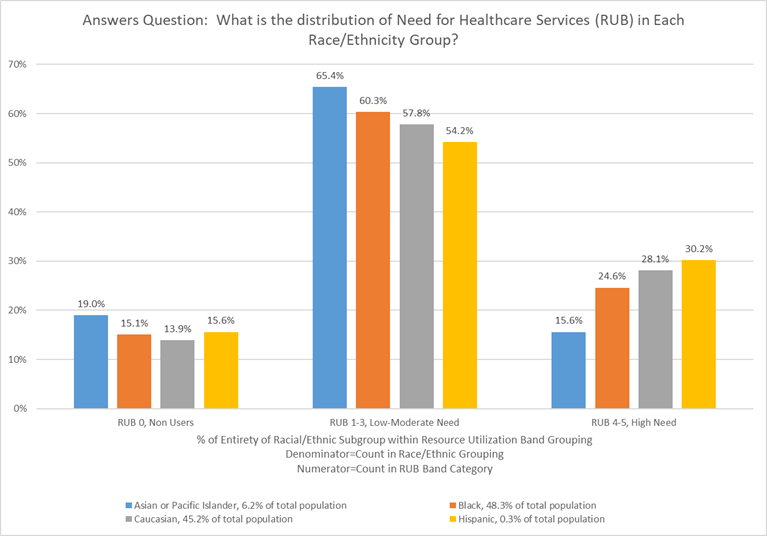
Question #2: What is the distribution of the anticipated resource use of health services (RUB) in each race and ethnicity group? (i.e., What portion of each race/ethnic group does each RUB represent?)

The two graphs above provide us with a better understanding of how to answer these questions. In order to understand the distribution of racial and ethnic groups within each RUB, we need to see the entire distribution of the Medicaid population being evaluated first. The first graph seems to suggest that Hispanic people make up a small portion of this population in all RUB categories. This can be misleading and lead to the (inaccurate) conclusion that few Hispanic people are in the highest RUB category for resource use.
Further analysis to answer the second question, as detailed in the second graph, reveals that 30% of the total Hispanic population is in the highest category for anticipated resource use. This suggests that the Hispanic population in our example have much higher resource use than expected. They may need more attention to address underlying disease burden or barriers to achieving optimal health outcomes. Also notable is that 19% of Asian or Pacific Islanders have no anticipated resource use, as shown in the non-user category. These data suggest that people who are Asian or Pacific Islander may not be accessing the health services they need such as preventative visits. Both findings can be explored through deeper analysis using the ACG System in order to more fully understand the underlying causes of these distributions.
Race and ethnicity are two optional variables that can be used in analysis by the ACG System to gain a deeper grasp of their impact on overall health, disease prevalence and population risk. Through such analysis, health plans and risk-bearing health systems can develop a thoughtful strategy and effective tactics to address equitable health care access and improve outcomes among their members.
If you have any questions or want to learn more about race and ethnicity values in the ACG System, please email us acginfo@jh.edu. If you are an existing ACG System customer, please contact your account manager.
Follow Us