In part 2 of this 2-part series, we talk to our James Barrett, Senior Technical Consultant at Johns Hopkins Health Solutions about the importance of using a combination of primary care and secondary care data in Population Health Management and the added value this brings. James presented this work at the PCSI conference in Slovenia in May 2024. Read part 1 of this series here.
Hi James. Can you remind us about some of the key messages from part 1 of this blog?
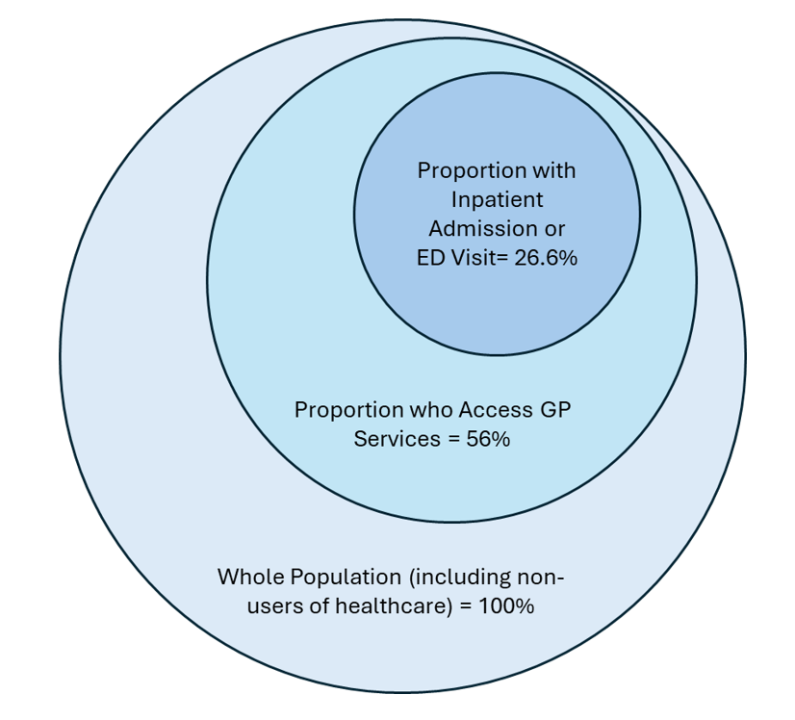
In the first part of this blog, we concluded that in general, secondary care data is more available than primary care data and many PHM projects are based on secondary care data alone.
We know that only a portion of a population will use hospital services each year. We also know that most unplanned hospital admissions are associated with high impact long-term conditions such as COPD, renal disease and diabetes. But we are also fortunate in the UK that the GP clinical record – the source of primary care data contains a comprehensive record of all the diseases and conditions we suffer from (see figure below).

So, what are some the limitations of only using hospital data to support population health activities?
There are two main limitations:
Can you give us some examples of the types of diseases that are only normally present in the primary care record?
Of course. Aside from those conditions that form part of the Quality and Outcomes Framework (QOF) disease registers, some examples that people reading this blog should be able to relate to as the chances are they have a family member or friend that suffers from one or more of them are:
That’s so interesting! So, for population health management (PHM) activities, you’re recommending the use of a data set that includes both secondary care and primary care data?
Yes, absolutely. As we have discussed earlier, hospital care records do not contain information about all the people in a population nor do they contain data about a range of diseases that are typically only treated (and therefore recorded) in primary care. The conditions listed above – and many others – contribute significantly to the morbidity burden within a population and should be considered in PHM activities.
Can you give us some examples of where using the both the full primary and secondary care dataset this has worked particularly well?
Of course! Firstly, let’s look at Leicester, Leicestershire and Rutland, where the ICB (LLR ICB) have designed a new funding formula for primary care.
The UK’s current funding formula for primary care (GP practices) is 20 years old and has never been based on the level of need of individual patients. This is known to disadvantage practices in deprived areas. In LLR ICB they have developed the formula where a significant element is based on the ‘case-mix’ of the population (using both the primary care and secondary care data sets) where the morbidity burden of each individual patient is considered when calculating the funding that a GP practice receives.
Practices that had long been recognised as being underserved by the old formula have seen an increase in funding. This includes not only practices in deprived areas, but also those with impactful morbidity patterns previously unrecognised by the old formula.
Three years on there is evidence that the new model matches the theoretical expectation of better identification of the variation in practice need and produces measurable reductions in health inequality, which are invisible to the current national GP funding formula.
You can read more about the work in LLR here.
That sounds great! In the first blog you spoke about the PNG segmentation tool. Any examples of how PNGs are supporting improvements in how care is delivered?
In the UK, primary care practices get paid for completing annual reviews for patients with a select group of chronic conditions – the QOF system. Typically, patients are called for review on or around their birthday, but Kumar Medical Centre in Slough have come up with a method for scheduling reviews using the PNGs from the ACG System to make the process more efficient and improve patients’ health outcomes.
Kumar Medical Centre is part of the Frimley Integrated Care System and is using segmentation methodology based on PNGs to schedule annual reviews for chronic conditions and assign appropriately experienced clinical staff for the level of complexity of the patient. More complex patients are seen early in the financial year to optimise their health before autumn and winter and therefore reduce the risk of an emergency admission. Patients can also be assigned a clinical practitioner with a level of experience related to their complexity. Both simple ideas but very effective.
More information about the work can be found here.
Thanks James. Any closing thoughts?
Well, I would like to reiterate that to undertake PHM activities effectively and to consider all patients in a population, you really should use a data set that includes both primary care and secondary care data. And if anyone would like to know about the examples we have shared, please visit hopkinsacg.org or contact us at acginfo@jh.edu. If you are a current ACG System customer, you can contact your Account Manager.
Follow Us