The Johns Hopkins ACG System is the world’s leading population health analytics software. The system continues to evolve, providing ever-more refined tools used in the US and across the globe for over 30 years, from commercial health plans and governments to health systems and large employers. The beauty of the ACG System is its ability to combine data from an array of sources to reveal powerful insights that go beyond just medical records. By identifying risk and tracking patients over time, the ACG System can help you plan ahead and reduce health care costs—especially valuable to risk-bearing health systems and provider organizations. Most importantly, the ACG System allows you to be proactive rather than reactive when it comes to your population’s unique health care needs. The system helps you combine a population-level perspective with patient-level behaviors and conditions. And because the system is incredibly flexible and responsive to new information, you can rest assured that no matter what comes next, the ACG System will continuously adapt to your health care management needs.
Based on the premise that clustering of morbidity is a better predictor of health care services resource use than the presence of specific diseases or disease hierarchies, the ACG System provides a multi-morbidity framework that is clinically logical, informative of future health care resources, easy to use and applicable to both financial and clinical managers.

Allows for Transparency

Relevant for Any Population

Clinical Relevance

Global Reach

Person-Centered Approach

Predictive Models

Reveals Performance Drivers

University Backing
With the ACG System you can identify up to 25% more individuals for care management before they become high utilizers. Optimize your case management and disease management programs by targeting individuals, assessing patient risk and identifying those who would benefit the most.
Coordination exerts an important impact on both the efficiency and effectiveness of care. Patients most in need of highly coordinated care include those with multiple chronic medical conditions, concurrent care from several health professionals or many medications and patients undergoing extensive diagnostic workups or transitions from one setting of care to another.
The ACG System Utilization Profile Report includes many concepts to evaluate population health, including concurrent and prospective risk, risk factors, utilization, disease prevalence, pharmacy adherence and care coordination risk.
The ACG System performance analysis takes into account the health of the particular population served by a specific clinician or set of clinicians, addressing important differences in casemix and the often stated concern that “my patients are sicker.” Because a disease-based focus may miss important implications of related co-morbidities, we provide a holistic view of the patient rather than the management of specific diseases or episodes.
The ACG System is widely used by health plans and health systems for risk adjustment, setting capitation rates, insurance premiums and for appropriately distributing health care resources within large health systems. The ACG System helps health care providers, payers and governments worldwide ensure that resources appropriately target populations in greatest need.
The ACG System can use pharmacy claims data as an input to supplement diagnosis information from claims data. The inclusion of pharmacy data can enhance the performance of the predictive models within the ACG System but can also be used to create several specific, pharmacy-related outputs. These outputs include:
An Adjusted Clinical Group, or “ACG”, is an actuarial cell—dozens of which form the building blocks of the Johns Hopkins ACG System methodology. ACG categories are a series of mutually exclusive, health status categories defined by morbidity, age and sex, and they’re based on the premise that the level of resources needed for delivering appropriate health care to a population is correlated with the illness burden of that population.
ACG categories are a person-focused method of categorizing patients’ illnesses. Over time, each person develops numerous conditions. Based on the pattern of these morbidities, the ACG System approach assigns each individual to a single ACG category. Based on Barbara Starfield’s original research in the 1970s, this concept that clustering of morbidity is a better predictor of health services resource use than the presence of specific diseases is still the basis of the current ACG System methodology, and remains the fundamental concept that differentiates the ACG System from other case-mix adjustment methodologies today.
Aggregated Diagnosis Groups, or “ADGs”, are the first step of the ACG grouping logic. There are thousands of diagnosis codes that clinicians can use to describe patients’ health conditions, and each of these codes is assigned to one or more of 32 diagnosis groups, or “ADGs”. The ultimate goal of the ACG algorithm is to assign each person to a single morbidity group (an ACG), but there are 4.3 billion possible combinations of ADGs. So to create a more manageable number of unique combinations of morbidity groupings, the 32 ADGs are collapsed into 12 “CADGs” (Collapsed ADGs). ADGs and CADGs can be used for various analytic and research applications that don’t require mutually exclusive categories, such as multivariate predictive or explanatory models.
The ACG System classifies all pharmacy codes into pharmacy-based morbidity groups (ACG Rx-MGs) using the following clinical criteria:
All pharmacy codes (NDC, ATC or other national codes) can be classified according to these clinical criteria. An active ingredient count is also made available.
Get a better understanding of patient need and identify:
For a handful of carefully selected chronic conditions where administration of medications is warranted, and where specific medications that should be taken continuously can be identified, the ACG System provides indicators if a patient is receiving treatment and calculates potential gaps in availability of needed medications.
The ACG System Expanded Diagnosis Clusters (EDCs) are a tool for easily identifying patients with a specific disease or condition. The EDC methodology assigns diagnosis codes found in claims or encounter data to one of 286 categories, which allows Care Managers to find candidates for disease management and wellness programs.
The ACG System can also be used to evaluate the effectiveness of disease or wellness programs through segmenting the population by level of multimorbidity, enabling you to examine the results of your programs while accounting for coetaneous diseases.
The ACG System provides a robust set of clinical markers to help Care Managers target individuals who might benefit from case management programs. You can perform a quick assessment of an entire health care population or sub-group to identify patients at risk who may not already be identified through other programs. You can then drill down to patient-specific information to understand an individual patient’s risk factors or resource needs.
The ACG System provides a Comprehensive Patient Clinical Profile report for you to use during a clinical screening which contains information such as:
The ACG System helps you allocate health resources in a way that adjusts for morbidity and considers more than age, sex and geography. By incorporating patient clinical characteristics, the ACG System improves health care resource allocation by accounting for individuals’ expected medical needs. This ensures an equitable distribution of limited health care resources directing them to those populations who need them most.
The complexity (casemix) of people in different populations varies. This information can be used to allocate resources in an equitable way based on the overall morbidity burden of people in a population. The ACG System will automatically assign a six-level (“low” to “very high”) simplified morbidity category termed a Resource Utilization Band, or RUB. The RUBs are formed by collapsing the ACG mutually exclusive cells that measure overall morbidity burden into six distinct groups.
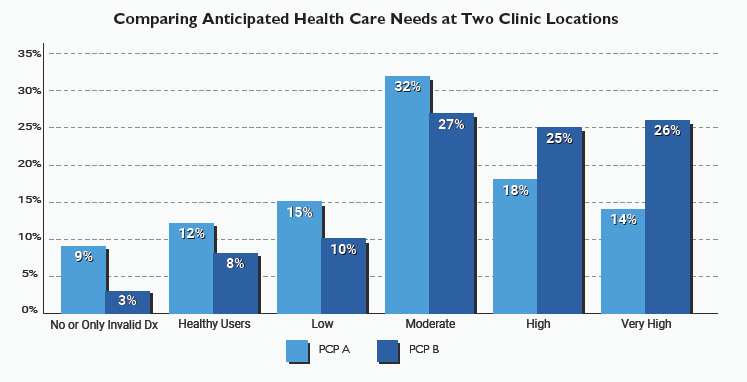
The following graph uses RUBs to compare anticipated health care needs at two clinic locations. Most of PCP A’s patients fall into non-user, healthy and low-moderate categories, while most of PCP B’s patients are in moderate, high and very high need groups. An ACG customer would use this information to further understand diagnostic or utilization trends across provider groups and individual providers and to finely tailor clinical program planning.

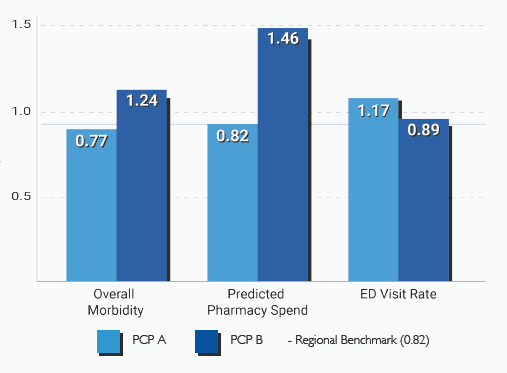
The example below shows that PCP A has healthier patients overall, as indicated by a concurrent risk of 0.77 compared to the population mean. Predicted pharmacy costs for those patients are anticipated to be 82% of next year’s average. Despite a healthier population, PCP A patients use Emergency Room services 17% more than expected given their health status, representing an opportunity for improved use of urgent clinic hours:

The ACG System’s whole-patient approach and methodological tools help provider groups, payors and those in value-based arrangements understand, compare, monitor and optimize performance. Through applying analytic insights across a population, organizations can monitor performance at-a-glance while accounting for common variations in disease burden and resource need between locations. Our casemix adjustment variables will facilitate establishment of benchmarks across locations, and support accurate predictions of resource need and utilization. Organizations can rely on the well-established science of Johns Hopkins tools for accurate measurement and globally-validated methodology.
Learn more in this case study.
The ACG System risk adjustment methodology is simple and straightforward and provides a relative population risk index that can be used to adjust capitation rates. It has long been a standard actuarial method for capitation and rate setting. ACG actuarial cells classify individuals by expected use of health care resources. Covered populations are sorted into these 102 ACG actuarial cells and either national weights or localized weights are applied.
For more than a decade, the ACG System has been used to facilitate the exchange of many billions of dollars within numerous private and public health plans in the United States, Canada and Sweden.
The ACG System’s rating methodology for setting health care premiums goes beyond demographics and considers individual health. You can set premiums at a fair level that provides more accurate and credible predictions of health care utilization. With more competitive renewal rates, you will achieve improved customer retention.
Research at the Johns Hopkins Bloomberg School of Public Health hypothesized that patients seen by clinicians who share patients more frequently have higher levels of communication and information sharing. The results demonstrated that through a better understanding of how patients are shared amongst clinicians, rates of hospitalization could be reduced and potential cost savings achieved. The following studies explore this in detail.
The ACG System provides a measure of patient sharing, termed “Care Density Score” based on this research. This patient-level measure indicates how much of the care of that patient is shared among clinicians.
Patients with poorly coordinated care have worse clinical outcomes and higher medical expenses than those with coordinated care. The ACG System developed Coordination Markers to identify populations at risk for poorly coordinated care.
A coordination risk measure combines these markers to determine whether a person has a “likely,” “possible,” or “unlikely” coordination issue. A care density ratio quantifies patient sharing based on outpatient face-to-face visits with eligible physicians.


Sollis has been delivering business intelligence and health care analytics solutions to the UK National Health Service (NHS) for 20 years.
We have a long and established relationship with the Johns Hopkins University where we have successfully integrated the ACG® System into our health care business intelligence software – Clarity Patients.
We believe that our collaboration with the world renowned Johns Hopkins University has resulted in one of the most advanced clinically based commissioning decision support systems available to the UK health care system.
Sollis Clarity Patients is the largest implementation of the Johns Hopkins ACG System in the UK.
It currently supports 29 Clinical Commissioning Groups (CCGs) and 868 GP Practices.
In 2013, Sollis collaborated with the ACG International Team and NHS Central Southern CSU to recalibrate the predictive models in Version 10i of the ACG System to better reflect the NHS context. This enables the ACG System to more accurately capture the morbidity patterns within the NHS as well as the factors that contribute to increased risk within the local population. Central Southern CSU and Sollis agreed to make this enhancement available free of charge to other non-Sollis NHS implementations.
We continue to further develop Clarity Patients while integrating the ACG System to support service transformation and outcomes based commissioning for the UK NHS.
With only one year of diagnostic and/or pharmacy codes, the ACG System performance metrics provide the information needed to drive change at the organizational level and to influence voluntary changes in clinician behavior. These reports can be used to:
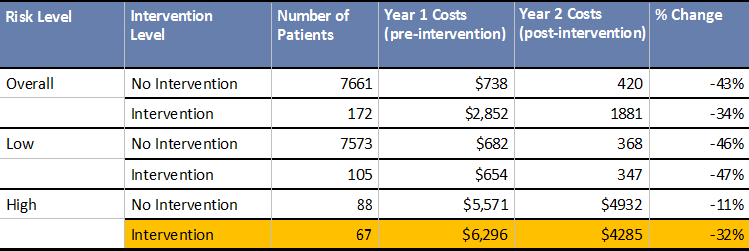
The example below demonstrates how the ACG System controls for case mix differences and also risk-adjusts the population enrolled in a program.
Focusing on high-risk patients, results show that those enrolled in the intervention program experienced reductions in cost that far exceeded the high-risk, no intervention group.

With a total disease burden perspective, the ACG System focuses on commonly occurring patterns of morbidity and assesses all types of medical need to achieve significant administrative efficiencies in the care management process, patient risk assessment and in patient targeting. This comprehensive approach has repeatedly proven superior to other case mix adjustment methodologies, especially those using complex data-mining or artificial intelligence algorithms where no two patients are categorized in the same manner.
The ACG System uses both pharmacy and electronic medical record data sources to select individuals based upon program-specific criteria, allowing care managers to spend more time with patients and less time on analysis. The clinical markers produced automatically eliminate the need to review records manually. The care manager is then able to understand a patient’s disease and morbidity profile; and select only the patients that truly warrant a detailed chart review.
The ACG System Predictive Models can identify up to 25% more individuals in need of care management intervention before they become high utilizers, compared to traditional methods based on prior utilization such as hospital concurrent review and emergency department utilization reports. By emphasizing developing patterns of morbidity, the ACG System helps identify individuals with a high disease burden—those seeing multiple clinicians and taking multiple prescriptions, as they may benefit from improved coordination of care.
Greater insight about the convergence of risk, medical utilization and prescribing patterns can be captured by combining risk defined by diagnoses with risk defined by retail pharmacy claims.
Patient adherence with therapy represents a major impediment to assessing clinical performance and contributes substantively to patient care costs and outcomes. The ACG RxGaps methodology was developed to capture patients with adherence issues and thereby improve their care management. Pharmacy benefits managers have made available refill patterns of patients to help identify potentially non-adhering patients who may warrant interventions by care managers. Unfortunately, the signal to noise ratio of these warnings is not high; there are many instances where gaps in adherence are expected, especially when medications are used acutely or as needed.
RxGaps employs innovative methods that increase the ability to detect genuine adherence problems by careful selection of conditions where chronic administration of medications is warranted, by the careful identification of specific medications that should be taken continuously, by capturing prescribing patterns that introduce potential noise and by identifying medications that may be validly substituted without introducing gaps in adherence. Generally, measurement strategies have targeted specific possession events (i.e., gaps) or average possession of time expressed as a ratio (supply over prescribing period). The RxGaps employs markers using both of these strategies as they address different dimensions of adherence. Gaps capture acute occurrences and may represent a therapeutically significant event that could be overlooked if only averages are considered. Averages represent how well medication is supplied over a span of time (i.e, one year) and are a good summary indicator of possession in assessing the overall status of a patient but may be less amenable to direct clinical action.